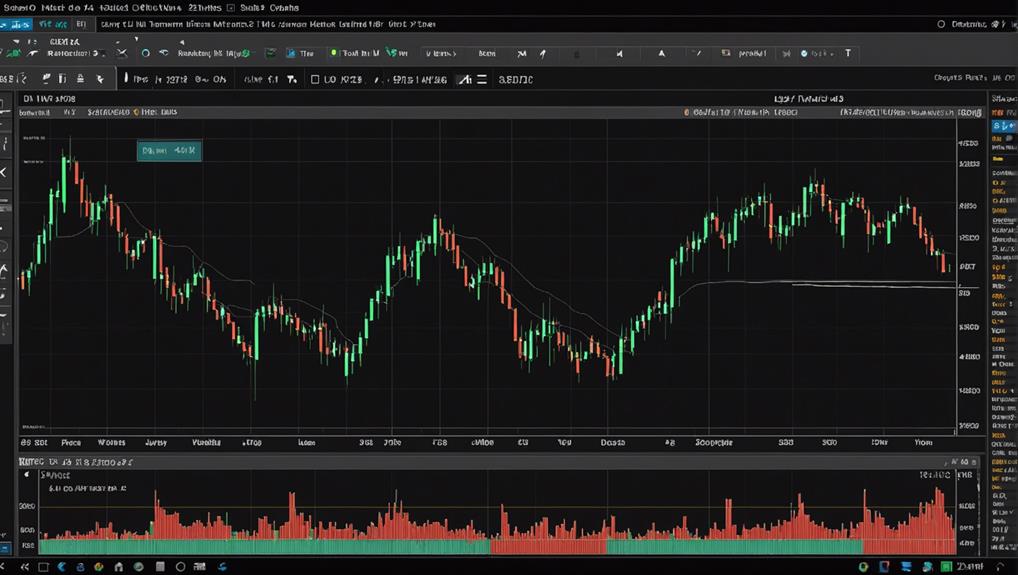
MetaTrader 4 Software empowers traders to compare advanced indicators like Moving Average Convergence Divergence (MACD), Relative Strength Index (RSI), Bollinger Bands, and Fibonacci Retracement. MACD pinpoints price changes, RSI assesses overbought/oversold conditions, Bollinger Bands analyze volatility, while Fibonacci indicates support/resistance levels.
These tools offer valuable insights for traders seeking to enhance their technical analysis skills and make informed decisions in the dynamic world of online trading. Each indicator plays a significant role in providing important information for effective trading strategies. Mastering these indicators can lead to improved performance and profitability in the markets.
Overview of MetaTrader 4 Software
MetaTrader 4 Software revolutionized the world of online trading with its user-friendly interface and powerful analytical tools. Traders can customize their charts to suit their preferences, allowing for a personalized trading experience. This chart customization feature enables users to adjust colors, timeframes, and indicators, providing a detailed view of the market.
Moreover, MetaTrader 4 excels in technical analysis, offering a wide array of tools such as trend lines, Fibonacci retracement, and various chart types. These tools empower traders to conduct thorough analysis of price movements, identify trends, and make informed trading decisions. The platform’s technical analysis capabilities extend to the ability to overlay multiple indicators on a single chart, enabling traders to spot potential entry and exit points with greater accuracy.
Moving Average Convergence Divergence (MACD) Indicator
The Moving Average Convergence Divergence (MACD) indicator provides traders with a powerful tool for identifying potential changes in a security’s price direction. By analyzing the MACD histogram, traders can gain insights into the momentum of a security’s price movement. The MACD histogram visually represents the difference between the MACD line and the signal line, offering a clear depiction of whether a security is gaining or losing momentum. Traders often look for crossovers between the MACD line and the signal line as potential buy or sell signals.
Furthermore, interpreting the MACD signal line is essential for understanding potential trend reversals. When the MACD line crosses above the signal line, it is considered a bullish signal, indicating a potential upward trend. Conversely, when the MACD line crosses below the signal line, it suggests a bearish signal and a possible downward trend. Mastering MACD histogram analysis and MACD signal line interpretation can greatly enhance a trader’s ability to make informed decisions in the dynamic world of trading.
Relative Strength Index (RSI) Indicator

Analyzing price momentum, the Relative Strength Index (RSI) indicator offers valuable insights for traders seeking to gauge overbought or oversold conditions in a security. The RSI strategy effectiveness lies in its ability to indicate the strength and speed of price movements, allowing traders to make informed decisions. When the RSI surpasses the 70-level threshold, it suggests overbought conditions, indicating a potential upcoming price reversal. Conversely, when the RSI falls below the 30-level threshold, it signals oversold conditions, potentially indicating a buying opportunity. Traders often use RSI overbought/oversold signals in conjunction with other technical indicators to confirm trends and minimize false signals. Understanding the nuances of interpreting RSI signals is essential for maximizing its utility in trading strategies. By incorporating RSI analysis into their trading approach, traders can gain a deeper understanding of market dynamics and potentially enhance their trading performance.
Bollinger Bands Indicator
Incorporating Bollinger Bands into trading strategies enhances traders’ ability to analyze price volatility and potential price reversals in securities. Bollinger Bands strategies involve using a combination of a simple moving average and two standard deviations plotted above and below it. Traders often look for price action near these bands to determine potential entry or exit points. Volatility analysis with Bollinger Bands is key; when the bands expand, it suggests higher volatility and potential trading opportunities, whereas contracting bands indicate lower volatility and a period of potential consolidation.
Customization options for Bollinger Bands include adjusting the period length of the moving average and the number of standard deviations used. These settings can be tailored to suit different trading styles and timeframes. Traders can experiment with various combinations to find the most suitable setup for their specific strategies. Utilizing Bollinger Bands effectively requires a deep understanding of how price interacts with the bands and the ability to interpret these interactions accurately.
Fibonacci Retracement Indicator

Utilizing Fibonacci Retracement levels in technical analysis provides traders with a powerful tool to identify potential support and resistance levels in price movements. Fibonacci levels analysis involves using key percentages such as 23.6%, 38.2%, 50%, 61.8%, and 100% derived from the Fibonacci sequence. These levels are believed to indicate potential areas where price may retrace before continuing in the direction of the trend.
Price retracement strategies based on Fibonacci levels are popular among traders due to their ability to pinpoint entry and exit points with a high probability of success. Traders often combine Fibonacci Retracement with other technical indicators to confirm signals and increase the accuracy of their trades.


