Using moving averages in MT4 analysis can help traders make better decisions. These tools give insights into market trends and when to enter or exit trades.
It's not just about using moving averages; it's also about understanding how to read them correctly. This means more than just looking at when lines cross; it's about knowing how to use moving averages with other indicators to create a strong trading plan.
Understanding Moving Averages
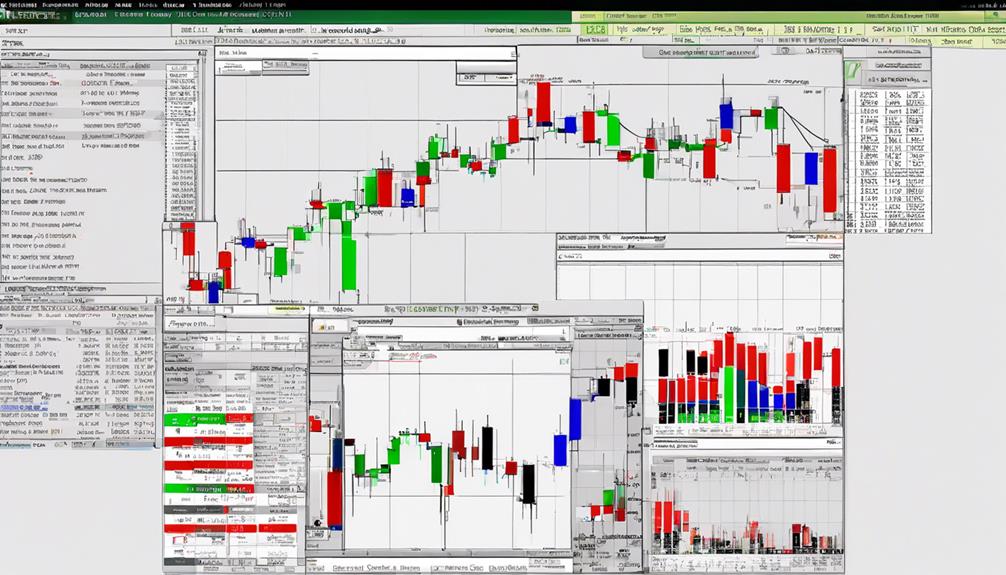
Moving averages are helpful tools for understanding market trends and potential price movements. They work by averaging out price data over a specific time period, which helps smooth out fluctuations and make trends easier to see. By focusing on the average price of an asset over time, moving averages can help traders filter out noise and focus on the direction of the trend.
There are many ways to use moving averages. Traders often use them to find support and resistance levels, with popular choices being the 50-day and 200-day moving averages. Moving averages can also show when a trend might be changing direction. This happens when a shorter-term moving average crosses above or below a longer-term moving average, a strategy called a moving average crossover. They can also help confirm how strong a trend is and show good times to enter or exit trades.
Understanding and using moving averages well can really help traders make better sense of what's happening in the market and make smarter decisions.
Types of Moving Averages
When you're looking at data with moving averages, it's important to know about the different types.
There are three main types:
- Simple Moving Average (SMA)
- Exponential Moving Average (EMA)
- Weighted Moving Average (WMA).
Each one has its own special features and uses in analyzing data.
Popular MA Variations
Different types of moving averages are used by traders and analysts to understand market trends better. Here are some popular variations:
- Weighted Moving Average (WMA): Gives more importance to recent data, making it react faster to price changes.
- Triple Exponential Moving Average (TEMA): Averages the price data three times for each point, creating a smoother trend line.
- Hull Moving Average (HMA): Adjusts its parameters to reduce delays and noise, making it great for accurately spotting trends.
These variations provide advanced tools and strategies for traders wanting to improve their technical analysis skills.
Simple Vs. Exponential
When we compare Simple Moving Average (SMA) and Exponential Moving Average (EMA), we see how they work differently in analyzing the market.
The Simple Moving Average (SMA) looks at the average price over a set time period, giving each data point the same importance. This can create a smoother line on the chart, but it mightn't react quickly to sudden price changes.
On the other hand, the Exponential Moving Average (EMA) gives more weight to recent prices, so it reacts faster to price movements compared to the SMA. Traders often use SMAs to spot long-term trends, while EMAs are better for catching short-term price changes.
Knowing the difference between SMA and EMA helps traders choose the right moving average based on their trading style and goals.
Weighted Moving Averages
Weighted Moving Averages are a way to look at recent data more carefully than older data. There are different methods to do this:
- Linear Weighting: This gives more importance to the most recent data points.
- Triangular Weighting: This method gives more importance to recent data points but also considers some older data points.
- Volume Weighted Moving Average (VWMA): This method gives more weight to data points with higher trading volumes.
Setting Up Moving Averages on MT4
When you set up moving averages on MT4, you can see how the price of a financial instrument has been changing over time. You can customize the moving averages by choosing the type (Simple, Exponential, or Weighted), the period (how many data points to include), and the applied price (open, close, high, low, etc.). This helps you tailor the moving average to fit your analysis needs.
MT4 also lets you test your strategies using moving averages. By looking at past price data, you can see how well different moving average settings work in spotting price trends and giving buy or sell signals. This testing helps you improve your strategies, fine-tune moving average settings, and make better decisions based on what's happened before.
Interpreting Moving Average Crossovers
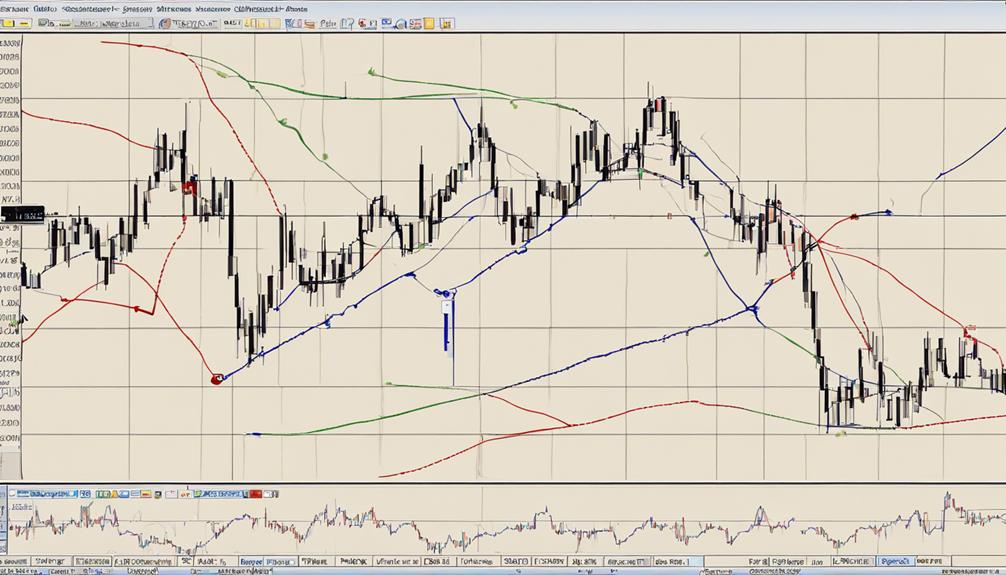
Moving average crossovers are like signals for traders. They help us know when the trend might change, when to enter or exit trades, and confirm if the momentum is strong.
By looking at where different moving averages cross each other, traders can get important information about how the market is moving and make smart choices.
It's important to know what these crossovers mean so we can create good trading strategies using technical analysis.
Signal for Trend Change
One way to tell if the market might be changing direction is by looking at different moving averages. When you see moving averages crossing over each other, it can give you a hint about whether the trend might be switching.
- Bullish crossover: This happens when a short-term moving average goes above a long-term moving average, suggesting the market might go up.
- Bearish crossover: This occurs when a short-term moving average crosses below a long-term moving average, indicating the market could be heading down.
- Wait for price confirmation: It's common for traders to wait for the price to move in a way that supports the trend change signal before making any decisions.
Entry and Exit Points
Using moving average crossovers can help traders know when to buy or sell in the market. When a short-term moving average goes above a long-term one, it might mean the market is going up, so it's a good time to buy.
On the other hand, if a short-term moving average goes below a long-term one, it could signal the market is going down, so it's a good time to sell. These crossovers can help traders spot when trends are changing and take advantage of price movements to make money.
Momentum Confirmation
Using moving average crossovers can help us see when the market's momentum is changing. When we see a moving average crossover, we look for signals that confirm if the trend is really shifting.
Here are three important things to think about:
- Golden Cross: This happens when a shorter moving average goes above a longer moving average, showing a possible uptrend.
- Death Cross: On the other hand, the Death Cross occurs when a shorter moving average goes below a longer moving average, suggesting a potential downtrend.
- MACD Indicator: The MACD is a popular tool that uses moving averages to spot changes in a stock's trend.
Knowing these signals can make momentum indicators more helpful when making trading choices.
Using Moving Averages for Trend Analysis
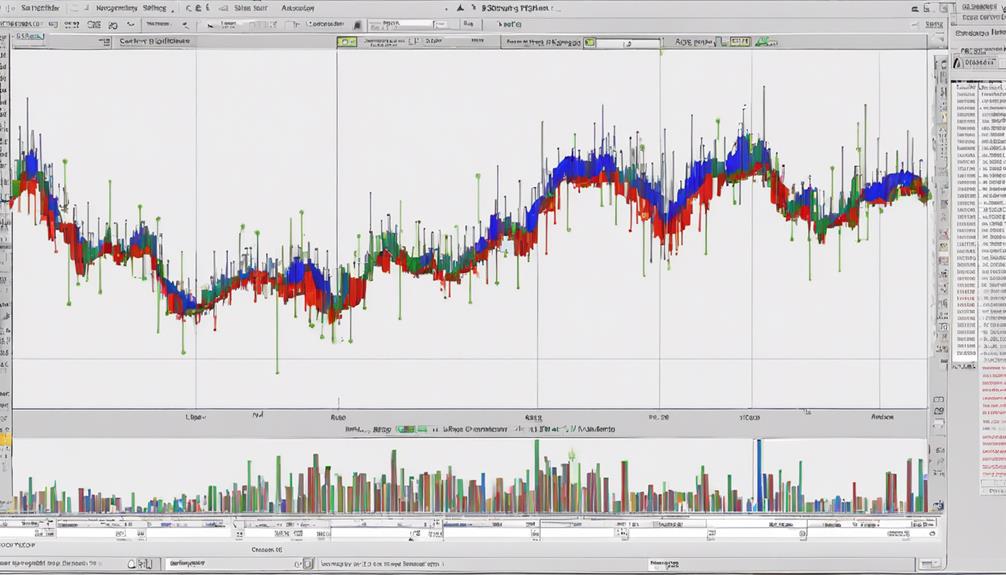
When looking at trends using moving averages in MT4, traders watch how different moving average lines interact to figure out where the market might be headed. By using moving averages for trend analysis, traders can see which way the market is moving overall and make smarter trading choices. The main idea is to see how different moving averages work together to show trends.
Here's a simple guide to understand moving averages for trend spotting:
- Short-term Moving Average: If it crosses above the long-term one, it might mean an uptrend is possible. This confirms an uptrend.
- Long-term Moving Average: If it crosses below the short-term one, it could signal a possible downtrend. This confirms a downtrend.
- Both Averages: If they move in a parallel manner, it could mean the market is in a consolidation phase with no clear trend.
Implementing Moving Averages in Trading Strategy
Moving averages are helpful tools for traders to make better decisions and spot trends in the market. Here's how traders can use moving averages to improve their trading strategy:
- Testing the Past: Traders can look back at historical data to see which moving average settings worked best in making profitable trades. This helps them adjust their strategy to fit the current market conditions.
- Managing Risks: Moving averages can help set stop-loss levels and decide how much to invest based on the distance between the asset's price and the moving average. This way, traders can control potential losses and know when to exit a trade.
- Confirming Trends: By comparing different moving averages, traders can confirm market trends and know when to enter or exit trades based on the direction of the market.
